
In late July 2026, the Ministry of Land, Infrastructure, Transport and Tourism (MLIT) published its “FY2025 Urban Railway Congestion Survey”. A summary and theme of the report show that the average congestion of railways around Japan’s three largest metropolitan areas such as Kanto (Greater Tokyo), Kansai (Kyoto-Osaka-Kobe) and Chubu (Greater Nagoya) has increased since last year.

As shown above, the average railway congestion rate of the busiest sections of rail in Metropolitan Tokyo, Osaka and Nagoya in the 7th year of the Reiwa Era (2025) reached 143%, 117% and 126% respectively. This represents an increase of a few percentage points over the last several years. What do these numbers all mean? Does 139% congestion look like this:
The shocking 200% congestion rates reported in Japan and South Korea do not necessarily indicate more crowding than a 150% rate for the notoriously congested Guangzhou Metro Line 3; they are simply measured against a much emptier definition of a 'full' train. We need to understand what a “congestion rate” actually measures and why the calculations behind it leaves so much room for interpretation.
How to Calculate Congestion Rates
To start, we have to ask: What is congestion? According to the Cambridge Dictionary, congestion is defined as:
a situation in which a place is too blocked or crowded, causing difficulties
擁擠,阻塞
Extending to urban railways, congestion rates are a measure of how blocked or crowded train cars are, attempting to quantify the difficulties it is causing to passengers. Train car congestion can be rationalized as when passenger demand exceeds the train car’s capacity. I have briefly noted in my review of the new 2024 metro openings for the Beijing Subway on how to calculate line capacity below:
Beijing Subway Openings 2024 Part 1

In late December 2024, I hopped on a high speed train up to Beijing from Hong Kong. The reason? Some family from North America also happened to be in Beijing around this time for work. So why not go visit them and see some new metro lines at the same time. I can assure you, the former is the bigger motivator. I swear on a ex-KCR SP1900 series front coup…
But to recap, the theoretical capacity of a train line is defined by:
Frequency of service every hour × capacity of a train car × number of train cars in a train
The capacity of a line is compared with the actual observed demand to create a ratio between theoretical capacity and actual usage (observed demand):
Capacity Ratio = Observed Oneway Demand ÷ Theoretical Oneway Capacity
In Japan, this capacity ratio is known as 混雑率 (congestion rate) while Mainland China uses 满载率 (full load rate). Operators in East Asia usually present train congestion rates as a percentage of rated capacity while North American agencies typically express it as a ratio, called a volume/capacity ratio (V/C ratio) with 1 being “at capacity”, anything over 1 is overcapacity and anything under 1 is below capacity.
The above Beijing Subway article did not cover how planners determine the assumptions about the capacity of each train car (the divisor) that feed into the theoretical capacity equation. In the capacity ratio calculation, the assumptions driving capacity numbers of each train car can greatly change the magnitude of the divisor even if the dividend of observed passenger volumes remain the same. Now that we understand the basic formula for congestion rates, let's examine the variable that causes the most international confusion: how each country defines the “capacity” part of the equation.
Variations of the Capacity Equation Divisor
While I expect there is not much debate about how to count passenger volumes, what the world largely does not agree on is how to define the passenger capacity of a train car. Ask a North American, and a congested train car could be a train that has all seats taken with a bunch of standees. While someone from South Asia would think unless the train has people hanging out the side; it is crowded, not congested. The train might have the same design and size and experience the same demand, but will have different calculated rates of congestion if wildly different assumptions about rated capacities (i.e., what people consider a full train) are used.
The capacity of a train car is the number of people you can fit inside it. How you arrange the passengers inside is determined by the design of the train and assumptions on the passengers comfort expectations. The inside of said train car has two official sources of capacity: seats and floor space for standees.1 One of the biggest factors driving the capacity of a railcar is the ratio of seats and standees. This ratio is quite intuitive and luckily countries around the world largely agree/converge on the suite of methods used to calculate trains with different seating arrangements.
Start with Seating
On one end of the train capacity calculation spectrum are North American commuter operations and global intercity train applications. Here train capacity is usually defined as the number of seats on the train and the train cars are designed to maximize seating. If there are standees in the train, that train is overcapacity. This means in these cases capacity is just number of seats + zero standees. Additionally, seated capacity is also defined to be very discrete; each seat is assumed to hold exactly one person. I know in practice this may not be true in some edge cases. For example, you could have situations where children are doubling up with adults on seats but this is a rounding error compared to how interpretations of other aspects on how capacity is calculated have a greater effect on the result. Again, train car capacity calculations are about providing a sense of train capacity.
Some North American commuter or global intercity train operations may define capacity with an additional amount of standees. The capacity for extra standees can be arbitrarily defined as an additional factor, say 20% of seated capacity on a high speed train in China (which sells standing tickets) like below:
Or some operators use an absolute number (10 additional people per train car) with the assumption that standees will hang out in the vestibule of said intercity or commuter train and that is within design capacity in their eyes.
Add More Standees
In urban/suburban and regional railway contexts, capacity is always the sum of seated capacity and standing capacity. Standing room is the primary source of capacity. However, unlike seated capacity, standing capacity is not a discrete measurement and relies on an assumption of standee density. Standee density is defined as the number of passengers divided by train floor area available for standing. Operators typically express standee density as passengers per square meter. The amount of physical standing area in a train car is affected by the train’s seating arrangements, number of doors and the size of the train. For the same size of train, the more seats you have, the less train floor area you can devote to packing in standees.


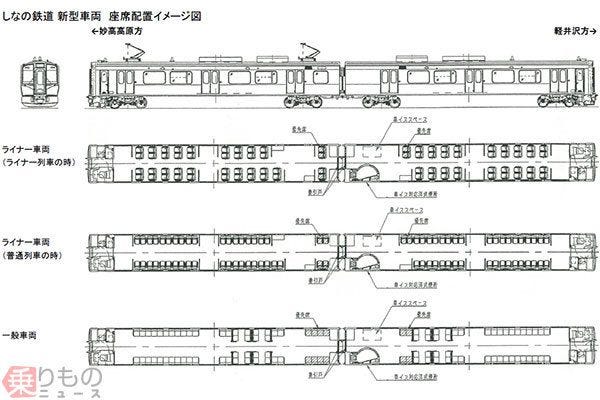
You can see that an urban train with longitudinal seating has a lot more train floor area devoted to standees. In that configuration, standees would make up the bulk of rated capacity. To drive the point home, below is the plan layout of different seating configurations for the refurbished JR-E E129 series train with a “liner” variant that can switch between full longitudinal or fully transverse seating. While the regular “commuter” train with mixed seating configuration:
At the extreme end of the capacity spectrum lies a train car design with no seats at all. The so-called “cattle car” configuration.
Bonus: Remove all the Seats
The other end of the extreme from intercity and North American commuter operations is if there are no seats also known as the cattle car. Cattle cars were famously used during Japan’s boom era, deployed on the JR-E inner suburban lines like the Yamanote or Chuo-Sobu Local services. Such seatless designs are very high capacity and full or partial cattle cars have reappeared in Beijing, Guangzhou, Shanghai and Seoul in the face of increasing congestion, in contrast to Osaka and Tokyo where they have largely disappeared. Capacity for such a vehicle is simply the floor area of the train multiplied by the assumed standee density as there is zero seated capacity.
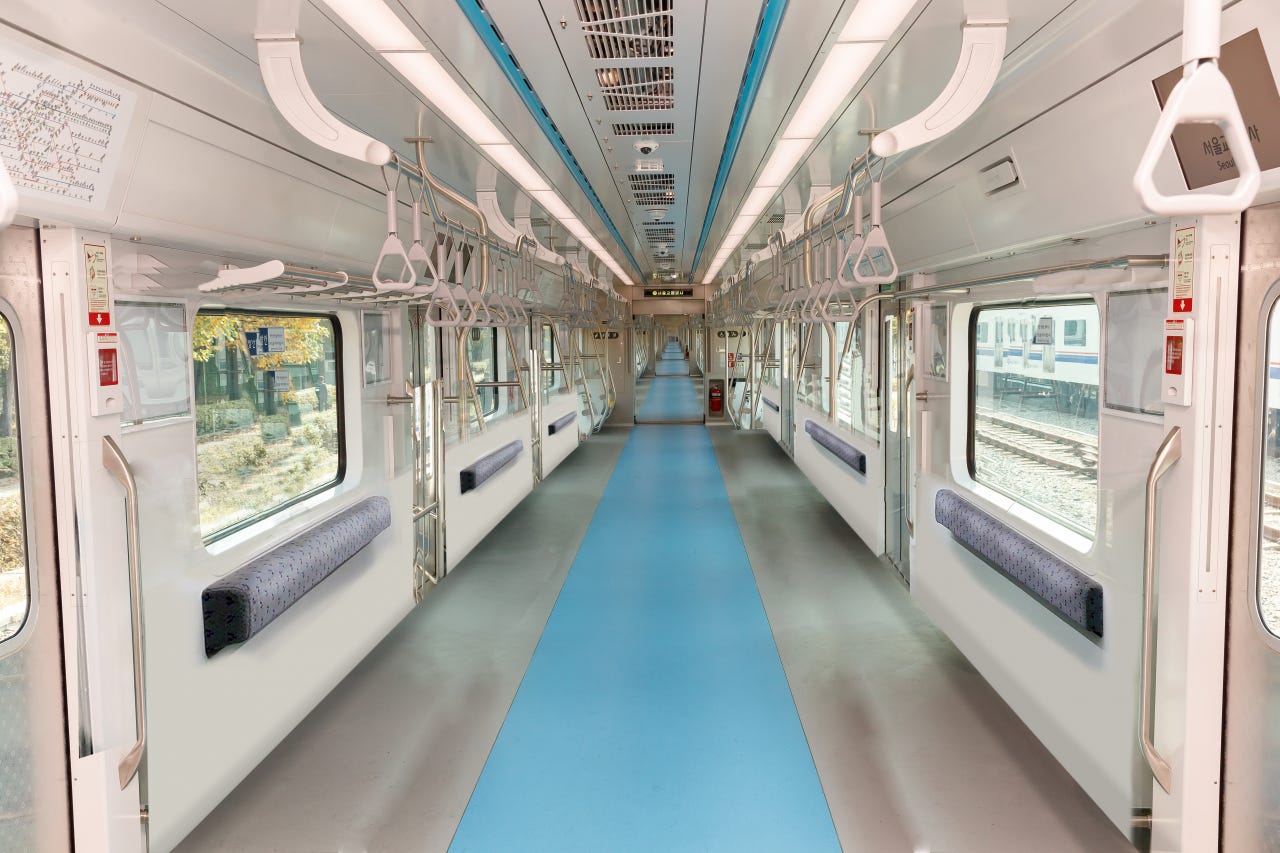
A useful mental experiment is to imagine your favorite metro train car with all its seats removed. You will find that removing all seats leads to a very high per-car passenger capacity. By extension different assumed standee densities will affect the assessment of what is deemed overcapacity for the same train car design. This mirrors how people culturally (North American vs. East Asian crowding) and contextually (urban vs. intercity) have different views on what constitutes a full train. The single most influential number in a train car’s capacity calculation is the assumed standee density. This is where global metrics diverge most sharply.
Standee Density, the Key Determinant of Rated Capacity
Broadly speaking congestion is subjective, as such the benchmarks for it will vary wildly around the world. This subjectivity is reflected in how across the world standee density is assumed with very different density thresholds even if all applications being compared operate in the urban rapid transit context. The high standee ratio usually found on urban and suburban trains leaves capacity calculations depend heavily on what planners assume to be an “acceptable” standee density. Again you can’t assume more than one person can use a seat but you certainly can assume more people can squeeze into one square meter of train floorspace for standees. This changes how capacity numbers are interpreted.
As a result, different standee density standards will lead to wildly different capacity figures for the exact same seating layout and train size. For example, Line 1 Yonge University in Toronto operated at capacity in 2019 with a demand of 28,000-30,000 passengers/hour/direction (pphpd). The Toronto Transit Commission (TTC) assumes the TR series trains used on Line 1 have a per-train capacity of 1,080 passengers assuming a standee density of 4 passengers/m². In fact, if you assume a standee density of 6 passengers/m², as the manufacturer (Bombardier now Alstom) does, the per-train capacity of the TTC TR series holds 1,458 pax.


As an example of how cattle cars vastly increase capacity, using the datasheet for the TR series from the manufacturer’s website above, a “cabless” intermediate B or C car carries 68 seated passengers and 182 standees. So each intermediate TR series car with a mixed transverse and longitudinal seating layout holds 250 passengers assuming 6 passengers/m² of standee density.
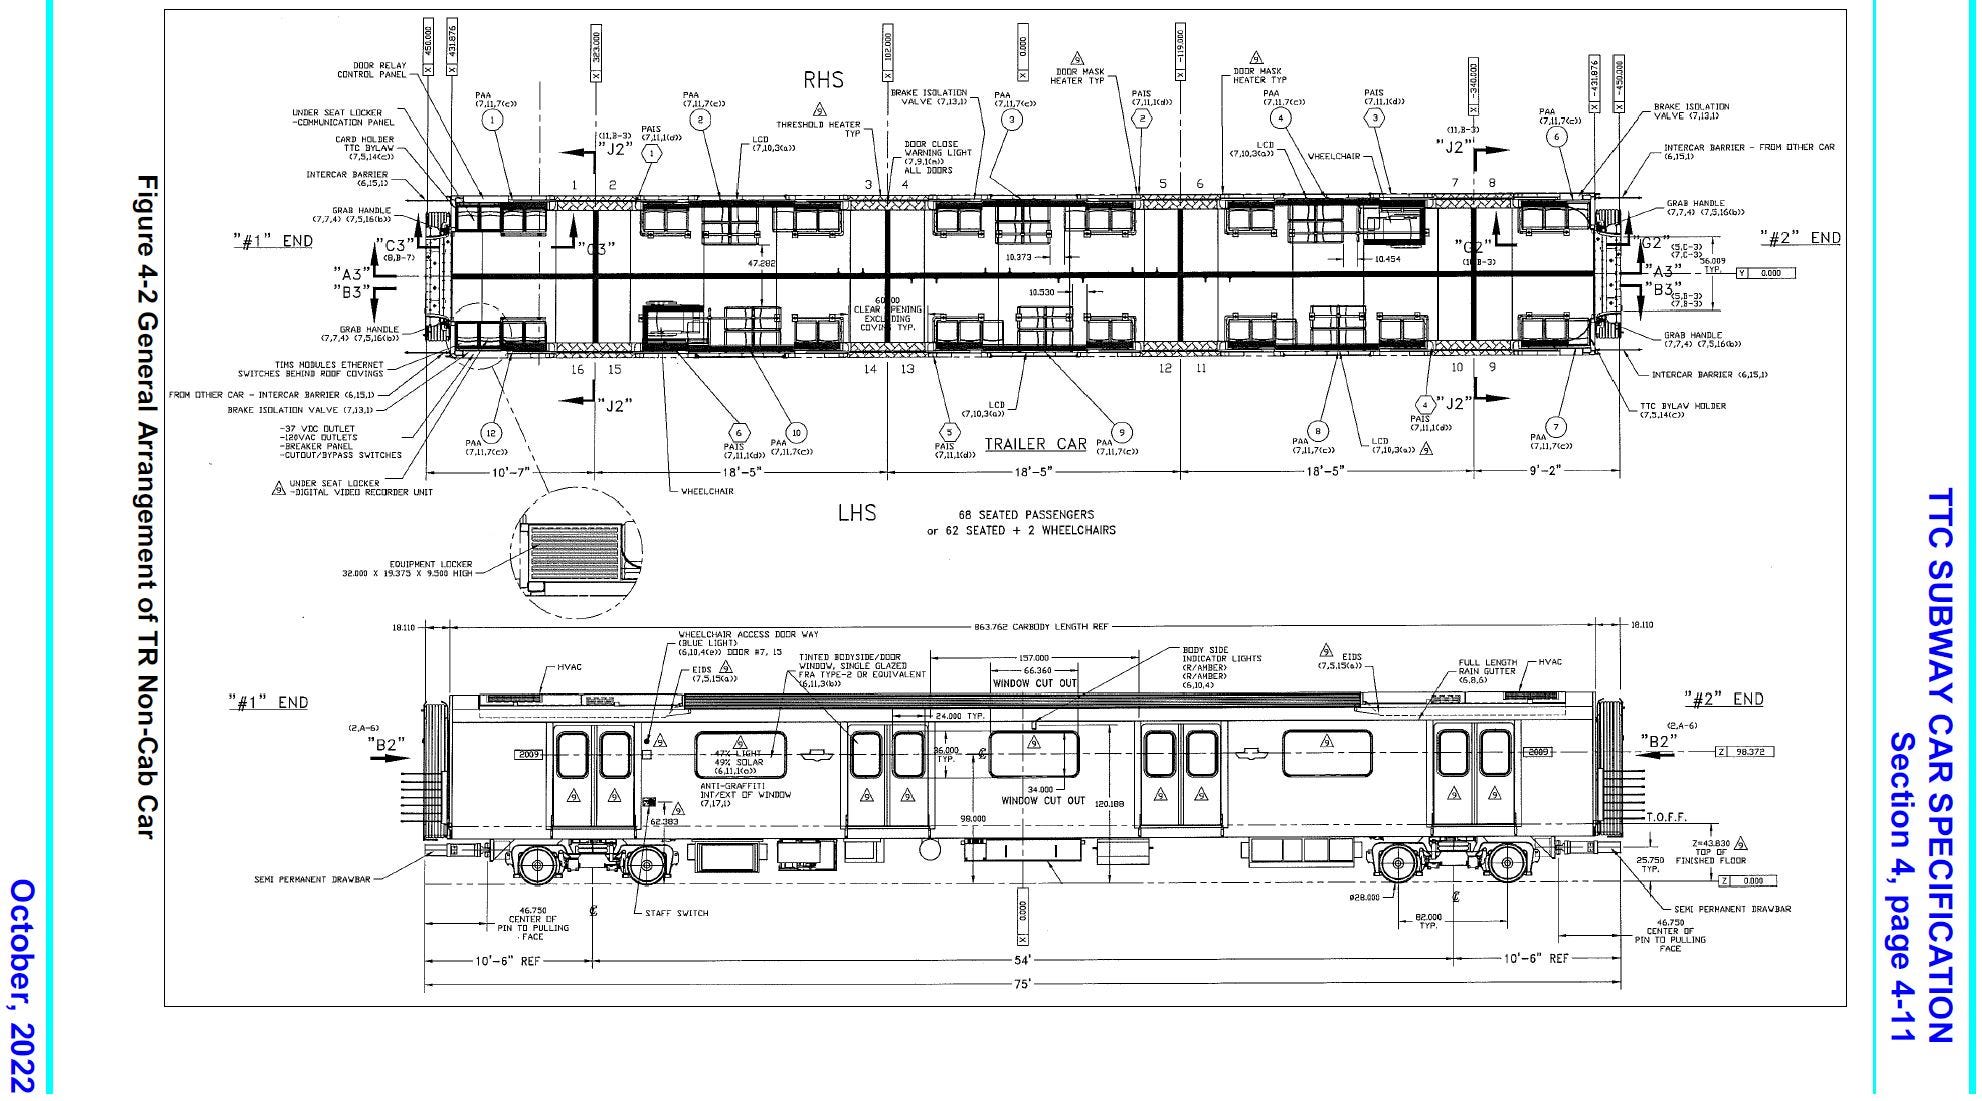
If one intermediate “cabless” TR series car were a cattle car, the capacity is just the internal floor area multiplied by an assumed standee density. Assuming 6 passengers/m² of standee density such a cattle car would hold over 400 standees. Even assuming a looser 4 passengers/m² such a hypothetical car would still hold over 270 standees. You can see:
The power of cattle cars but you are sacrificing comfort for capacity.
How the standee density assumption greatly changes the rated capacity of a train car even if the design doesn’t change.
So what is a Full Train?
This subjectivity of how you define a train as full fuels this misconception floating around about East Asian train congestion statistics. For example, there have been situations where South Korea and Japan report rush hour trains running at close to 200% capacity, captivating minds in Western popular culture. The vibes are generally not incorrect, those Oshiya were really required at major congested Japanese train lines in boom era Japan, particularly in greater Osaka and Tokyo. Seoul’s infamous Line 9 “Hell Line” (지옥철; ji-ok-cheol) as described by S.Y. Lee on their S(ubstack)-Bahn substack was still extremely congested based on my personal experience in 2016.
As noted above throughout history South Korean and Japanese urban railways reporting +200% crowding numbers fueled their reputation for overcrowded trains. China is also known for congested metro trains but really only report crowding statistics ranging from 100% to 150%.2 Korea may have a hell line but China has the notoriously congested “Hell West Road” Station (地狱西路; Di-yu Xi-lu; Dei-yok Sai-lo) or Tiyu Xilu Station. This Guangzhou Metro station is serving the most congested metro line on Earth, Line 3. However, Line 3 is not officially operating at 200% capacity:
Guangzhou Metro Line 3 Early 2026 Wellness Check

Many of my articles have focused on the continuous relief aspects of Guangzhou’s new metro lines to decongest Guangzhou’s metro network which was in a unique spot. Guangzhou is one of the most populated cities on Earth, with over 30 million people in its metro area.
This raises an important question: some context is needed behind the meaning of these numbers from Japan and South Korea. Both countries use surprising assumptions on what a full train standee density is. This is in contrast with China which assumes crowding in a very different way. Below are examples of Korean and Japanese metro system crowding metrics used today:


What is interesting is how qualitative the metrics are for both Korea and Japan. This is likely due to how crowding data is commonly collected, via manual visual inspection on site.
Korean Definition
Starting with Korea, the metrics above note a South Korean train deemed at 100% capacity still has quite a bit of room to move around. 100% is defined in S Korea with three rows of standees between the longitudinal seats and doors, 2 standees around each door. Seoul’s metro trains are quite wide by international standards being over 3.1m wide so with my eyeball math, three rows of standees between the two longitudinal seats works out to be about 3 passengers/m² of standee density. Each standard Seoul Metro train car has four 1.3 meter wide double stream doors per side of each car and uses all longitudinal seating. With these assumptions in mind, each standard 20m long and 3.1m wide Seoul Metro car assumes about 160 passengers as 100% “at capacity”.
According to the Seoul Metro peak loadings on Line 4 and 7 reaches 193% and 164% capacity respectively. Traditionally, the congested line in Seoul are Line 9 on the south side of the Han River which operated over 200% but recent improvements on Line 9 I suspect has reduced crowding.
Japanese Definition
Shifting focus to Japan, the MLIT metrics are even more qualitative in nature, determining crowding based on visual descriptions like:
100% — Commuters have enough personal space and are able to take a seat or stand while holding onto the straps or hand rails.
150% — Commuters have enough personal space to read a newspaper.
180% — Commuters must fold newspapers to read.
200% — Commuters are pressed against each other in each compartment but can still read small magazines.
250% — Commuters are pressed against each other, unable to move.
An older expanded MLIT train crowding standard from over 20 years ago included a bonus 300% reference where “[Commuters] are near their limits and there is physical risk.”:
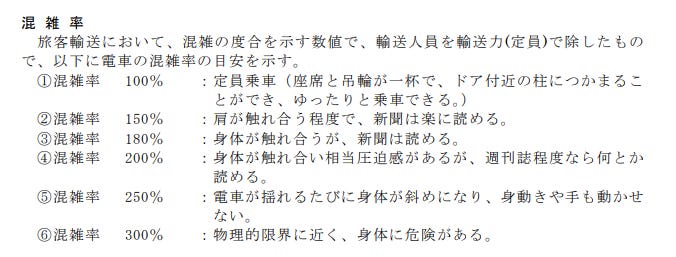
This is a holdover threshold from Japanese Bubble Economy Era congestion where some trains in the Kansai and Kanto area did reach these extreme levels of congestion, particularly parts of the Kanto JNR regional system:
Declining ridership caused by the Lost Decades of the Japanese economy in addition to gradual rail service improvements combined with changing consumer tastes (No one reads a newspaper on the train these days) prompted MLIT to revise their 20 year old train qualitative crowding metrics in August 2025. The new standard removes references to paper reading materials and redefines the higher levels of crowding.
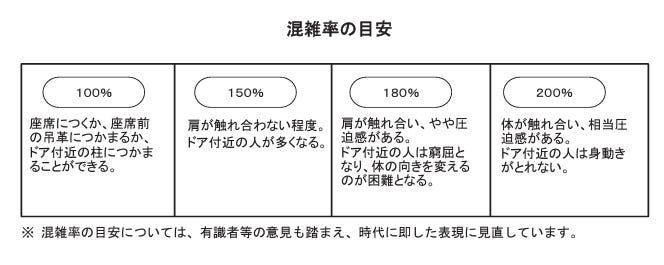
Which are as follows:
100% — Train at capacity (all seats, straphangers, and handholds near the door taken)
150% — Standee’s shoulders don’t touch, crowding around the doors
180% — Standee’s shoulders touch and there’s slight pressure. People near the door feel cramped and have difficulty turning around
200% — Bodies are touching and there is a great sense of pressure. People near the door are unable to move.
Note that MLIT has removed descriptions for 250% crowding as such extreme crowding does not exist in Japan anymore in the Reiwa Era (more on this in a future substack so Like, Share and Subscribe!). Such crowding lives on in the Guangzhou Metro today. It also further reduced how crowded a “full train” is. 100% capacity is now “all seats, straphangers, and handholds near the door taken” which still is a very empty train as there is a lot of standing space not near the doors. I guess this is a more pragmatic human centered approach that the Japanese have now adopted to measure crowding. It also reflects how train crowding has been changing in Japan (read: decreasing). Japan knows that everyone has experienced seeing a train with everyone packed around doors but you can see lots of space to stand in the area between the doors. However you would still think:
Too full, I’ll wait for the next train.
As a side note, in addition to qualitative measures, Japan, like many other countries also has a more quantitative method to quickly calculate capacity. Assuming a certain seating configuration, a general factor averaging out a set standee density, with the average amount of space one seat takes up in a train is developed. This general factor would be used in an equation below:
Dimensions of traincar ÷ General average passenger density factor = Capacity of train car
The MLIT's Annual Report of Railway Statistics (鉄道統計年報) and Urban Railway Congestion Survey normalize crowding using this method, with a general factor of 0.35 meters of train floor space per person. Train floorspace is different from standee space and is just the internal floor area of the traincar. In addition, the factor is counting both seated and standing passengers. Essentially in this method, the general factor assumes the seating layout of the train car to be using fully longitudinal seats and a door density of four dual stream doors per side of a 20m Japanese or three doors per side for shorter 17-18 m cars. The method then works out an average allotted space per passenger regardless if they are sitting or standing. Notice the inverse of this general factor is 2.9 passengers/m² of train floor area. Rounding this inverse to account for the fact that a person in a seat takes up more space, you get an implied standee density in this method for a “full” train to be just over 3.25 passengers/m².
As you can see regardless of methods used for calculation, Japan and S Korea both in their own way essentially assume 100% capacity is an urban/suburban train with all seats taken and standees standing at just above 3 passengers/m² of density. My experience with both countries confirms this. Korean trains are increasingly more crowded than Japanese trains but you can still walk around a train defined as at 100% capacity using either Japanese or Korean crowding metrics.
Crowding Definitions around the World
Outside of Japan and Korea, the classic standard for planning was 6 passengers/m² of standee density is 100% capacity. Widely used around the world in the 1970s. Today outside of East Asia the maximum capacity standard is converging on 4 passengers/m² of standee density as shown by the Toronto TR Series example above.
This organic shift is logical, I reviewed the New York’s Hub Bound Report data on peak crowding into Manhattan in 2016-2017. Based on my knowledge of the North American subway commuter zeitgeist, sections of the the New York Subway’s Lexington, Broadway/7th Ave and L Train services were always well known to be the network’s most congested during peak periods. The report data supports my impressions. In 2016, before the opening of the 2nd Ave Subway Phase 1, the Lexington, Broadway/7th Ave Express services and the 14th Street Tunnel (L Train) are the only services providing on average less than 3.8 square feet of train floor space per commuter during the peak hour.
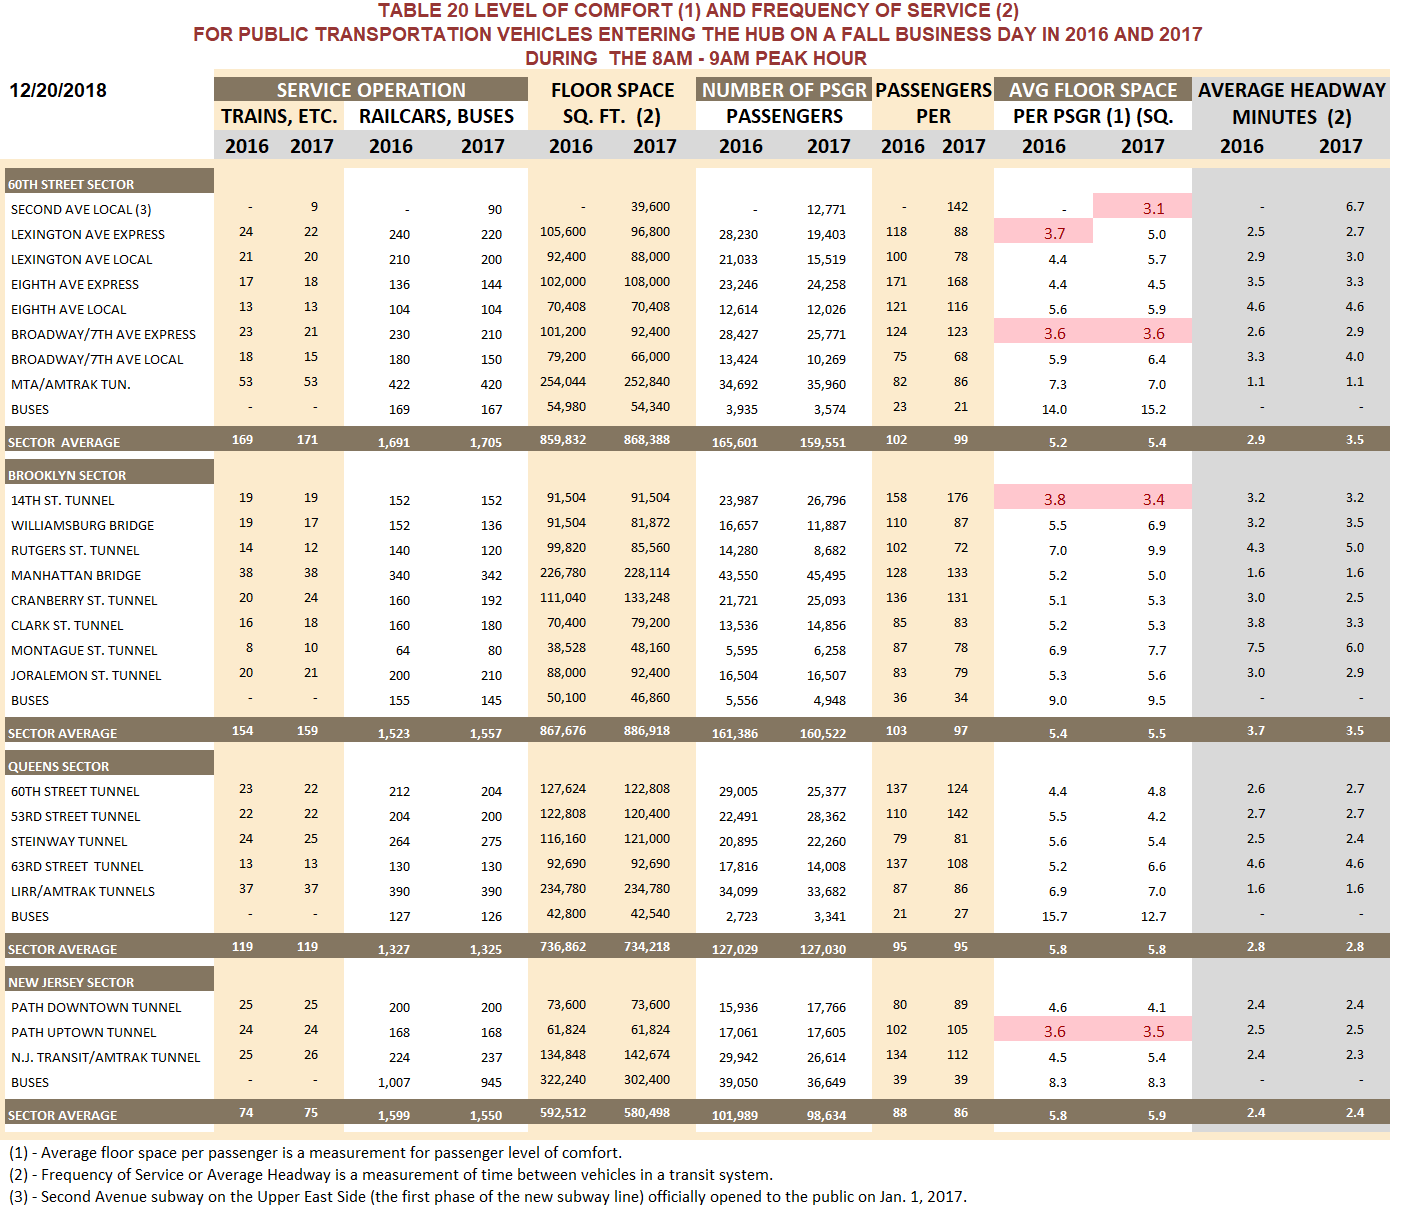
In non-freedom units, 3.8 square feet of train floor space/passenger also matches Japan’s general factor of 0.35 meters of train floor space per person. The inverse of that yields an average density of over 3 passengers/m² of train floor area. Which when adjusted for seated passengers the standee density approaches 4 passengers/m². Many of MTA’s recent high priority capital projects in the 2010s are geared to relieving crowding on these lines, which regularly exceeded 4 passengers/m². Such as:
L Train signalling and electrical upgrades for more frequent service.
2nd Ave Subway Phase 1 and 2 which would provide relief to both of the North Manhattan A Division corridors.
These projects were consistently worked on and supported despite MTA’s project delivery incompetence and high costs. This shows that when crowding approaches the threshold of 4 passengers/m² of standee density, the public starts putting pressure on pols. This creates political capital to prioritize and sustain improvement projects to fix these crowding issues.
In Toronto, where the Yonge Line between Eglinton and Bloor Stations was commonly noted to be congested but political football delayed the “Downtown Relief Line” project designed to remedy this. Since the late 2000s demand has slightly exceeded the scheduled capacity of the Yonge Line. As noted above, the TTC assumes the capacity of the Yonge Line’s fleet of TR series’ using a maximum standee density of 4 passengers/m². As approaches crowding 4 passengers/m², passengers are already not entering trains at some sections due to congestion, instead opting to wait for a less crowded train.


This congestion finally reached a point where a relief line project received enough support from the general public and the powers that be, was funded, and broke ground in 2019. Known as the Ontario Line; the half underground downscaled automated metro has had delivery problems to become one of the most expensive metro projects on Earth to construct. These two examples confirm that at least in North America, 4 passengers/m² is the maximum standee density that engineers should design for.
Hopping overseas, this shift to 4 passengers/m² maximum capacity is epitomized in Hong Kong. Hong Kong today has a two tiered threshold straddling old and new. With a suggested 4 passengers/m² as “full” and the older 6 passengers/m² as an ultimate but non-sustainable crush load. This was done after observations by the MTR Corporation noted how unrealistic 6 passengers/m² is to achieve in practice these days. Passengers now simply crowd platforms as they hope for a less crowded next train. People, particularly in the developed world, are not as motivated to squeeze themselves onto a train these days. As the MTR Corporation put it to the HKSAR Government in April 2016:
“All train compartments of the existing MTR railway lines are designed based on the industry standard design adopted at the time of the construction of railway lines, and the maximum carrying capacity of train compartments is calculated based on an accommodation of up to six persons (standing) per square metre (ppsm) on average. However, it has been observed that over the years, passenger riding habits have changed. Nowadays, passengers are less willing to board a train that looks crowded even when there is still room available. They prefer waiting for the next train. This in effect reduces the carrying capacity of the trains and the railway line as a whole. In actual operation, trains running during the busiest hours on the busiest corridors achieve a passenger density of only around four ppsm.”
I’m sure parallels of this mentality can now be found in commuters in all other parts of the world leading to this convergence. While North America, Europe, and Hong Kong are converging on 4 passengers/m² as the practical maximum, China officially holds onto a much denser standard.
The China Syndrome
In contrast, China takes a different approach, as I noted in one of my first Substack posts, China’s metro design standards, GB 50157-2013 “Code for Design of Metro” (地铁设计规范), assumes a standee density of 6 passengers/m² as “at capacity”. While a crush loaded train is assumed to have a standee density of 9 passengers/m². See footnote at the bottom of table I posted below:

China to this day officially designs to this older standee density standard that is out of step with Chinese (and broader global) commuter preference. Some cities in China have independently planned and designed lines assuming a lower 5 passengers/m² for “passenger comfort”, after observing underbuilt disasters in Guangzhou and Beijing from afar. Those disasters made planners realize that 6 passengers/m² of standee density is not really a good target from a service experience perspective and you should not optimize train size to such a high level of crowding. This is why some smaller less dense Tier 2 cities like Shijiazhuang, Urumqi, Taiyuan or Zhengzhou have designed and built lines with higher capacity Type A trains.
Putting it All Together
Right out of the gate you can see how these standee density assumptions affect the calculated capacity and crowding rates, and then ultimately shape train design and transportation policy decisions. We have now surveyed the major global standards: 3 ppsm (Japan/Korea), 4 ppsm (emerging Western norm), and 6 ppsm (China’s official baseline). Let’s put these numbers side by side to see their real-world impact.
If measured using Japanese standards, an officially 100% full Chinese metro train would rate at just under 200% capacity in Japan or South Korea (which assume 3 passengers/m²) or 150% in Europe and North America (converging on a 4 passengers/m² assumption). A crush loaded Chinese train with 9 passengers/m² of standee density is rated to be 150% capacity in China but would be classed as the mythical 300% capacity in Japan. In China the closest their metro trains reached 300% capacity (if using the Japanese methodology of measuring crowding) is Guangzhou Metro Line 3 and 5 as well as Beijing Line 13 in the early 2010s:
I have been presenting many abstract concepts in this post. To understand what these abstract percentages mean for your morning commute, let's look at the literal floor space beneath your feet. To help you visualize, I marked out a 1 m² space in my flat for reference. I then put in some instant noodles and an 8 pack of regular 330mL coke cans I have on hand for scale:
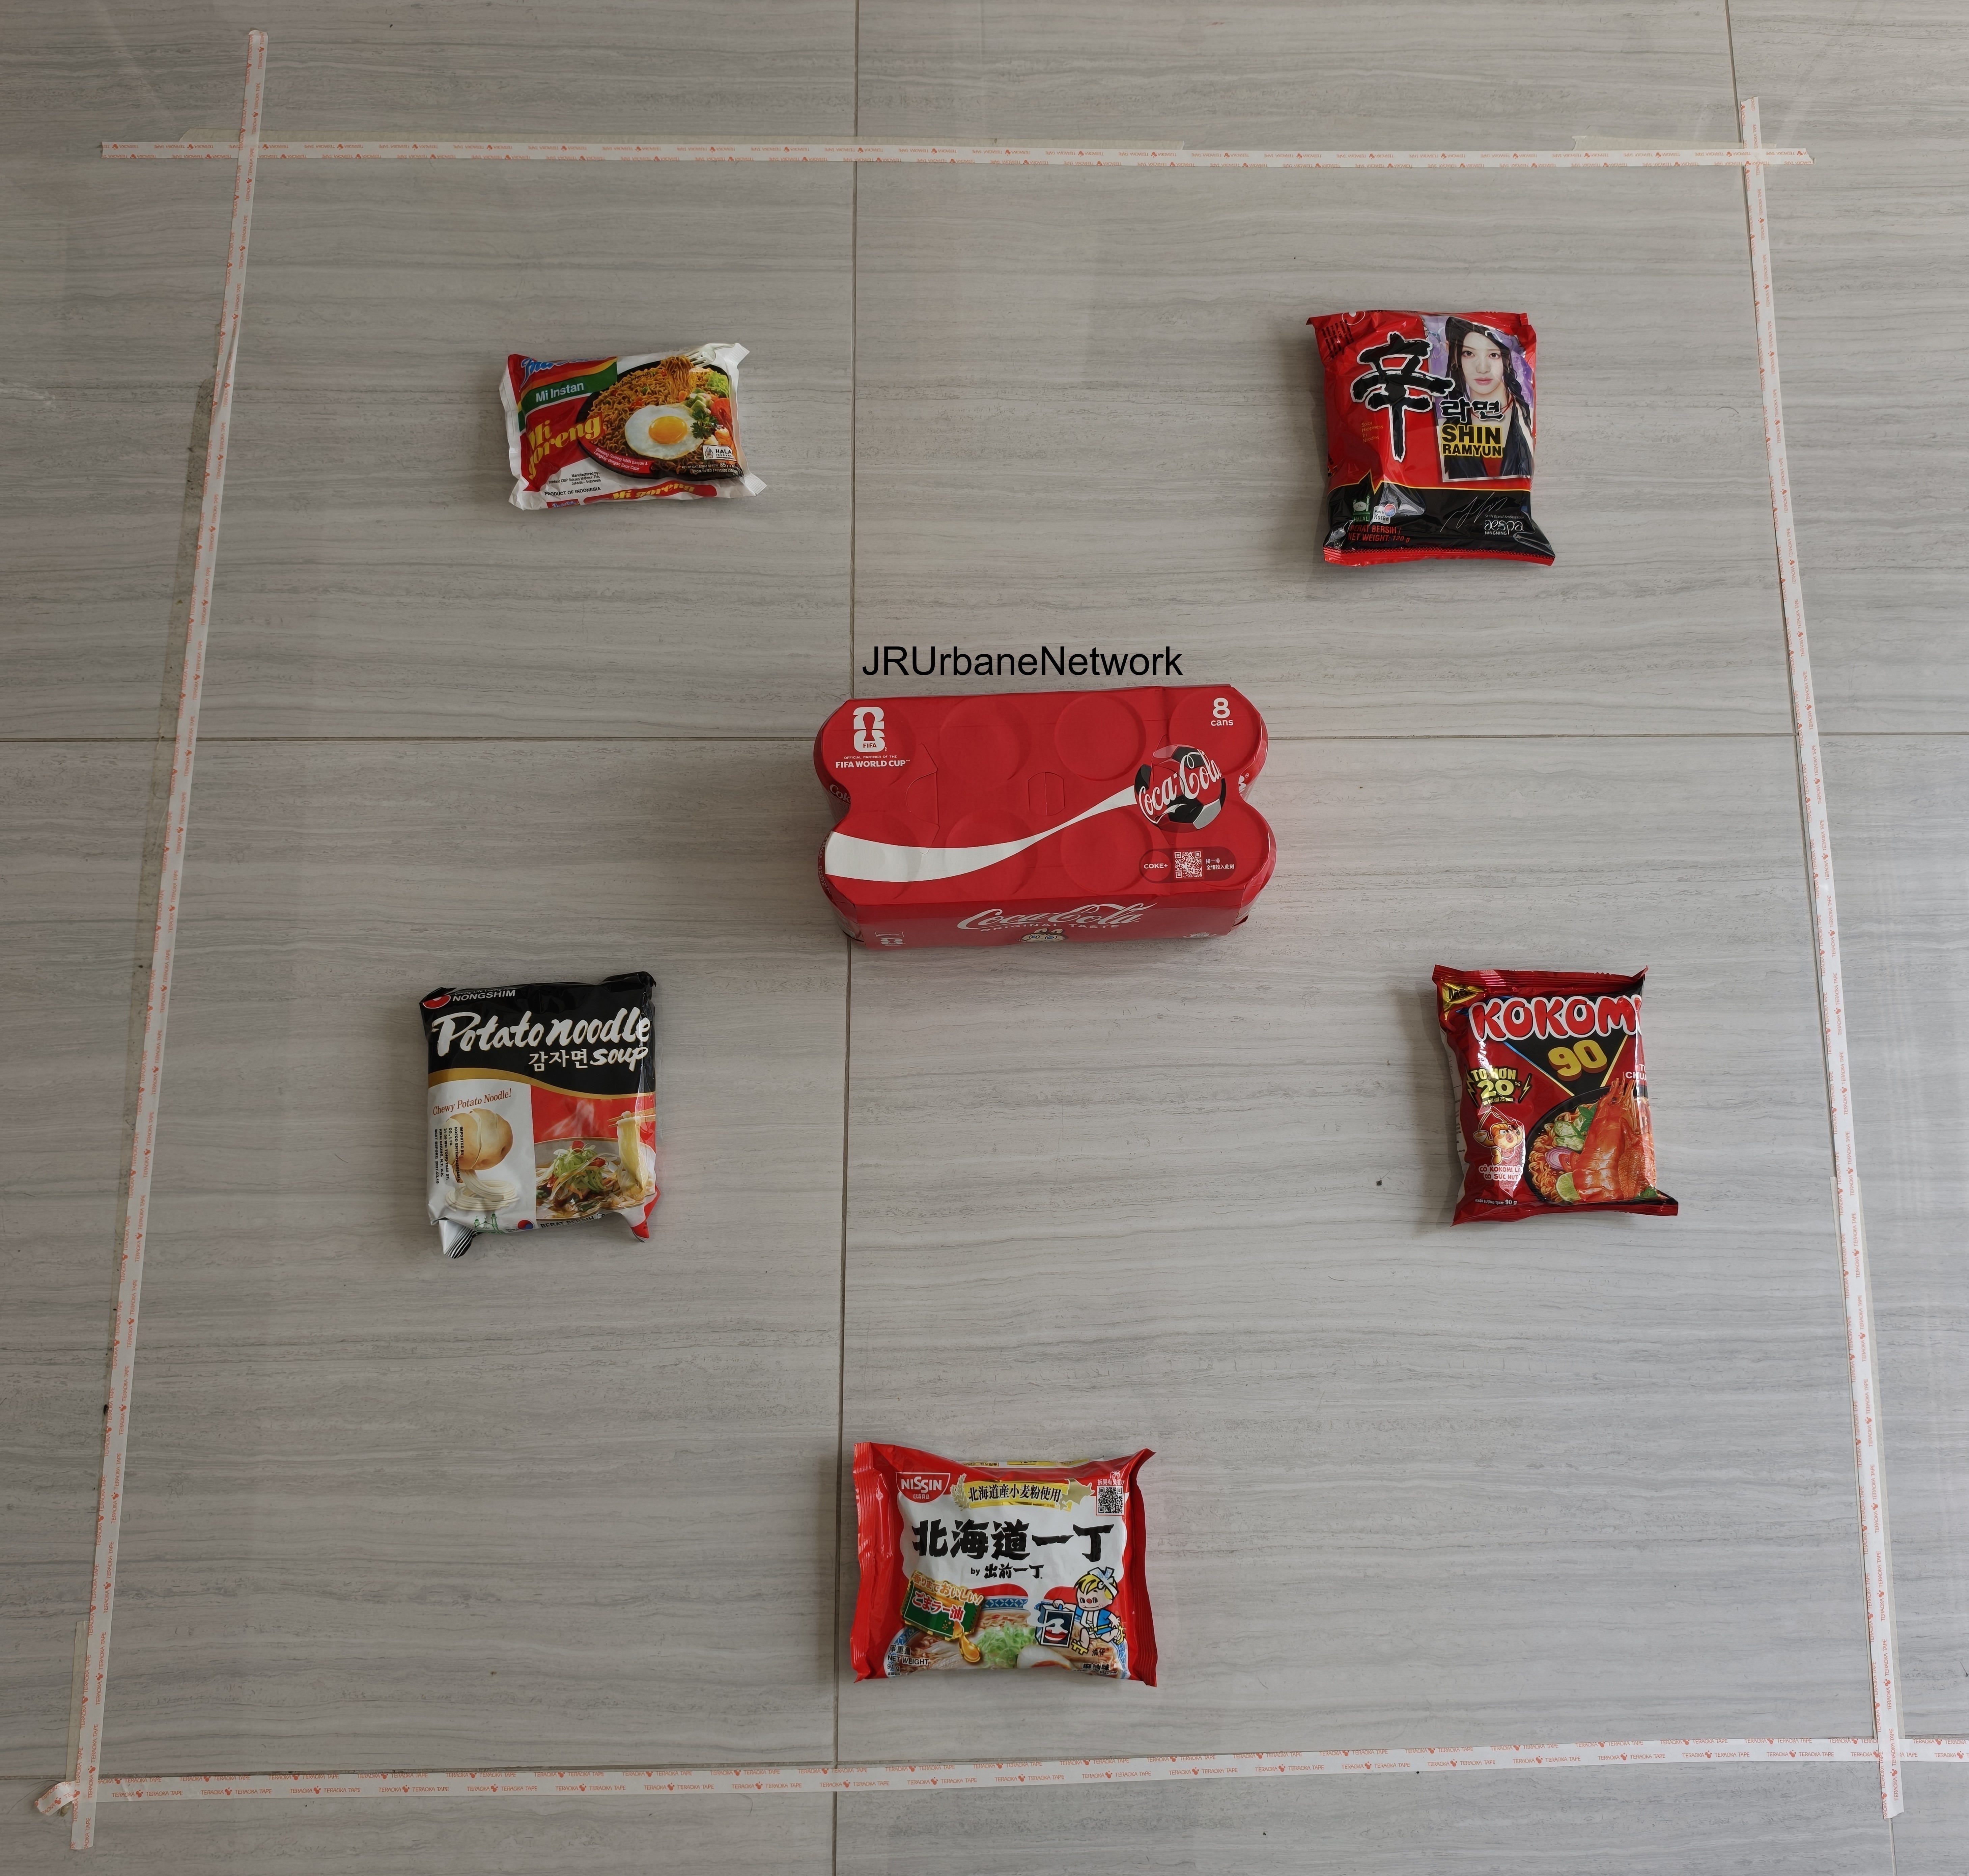
3 passengers/m²: The Japanese and Korean Baseline
I place three pairs of shoes varying from US size 7 to 9 in my 1 m² box. If you are ever standing in a train and want to know what is the crowding level look down and compare with the series of images below. If you see feet with about this spacing during your standing train ride, this is 3 passengers/m² of standee density. Japan and South Korea would consider a train like this with all seats taken as operating close to 100% capacity.
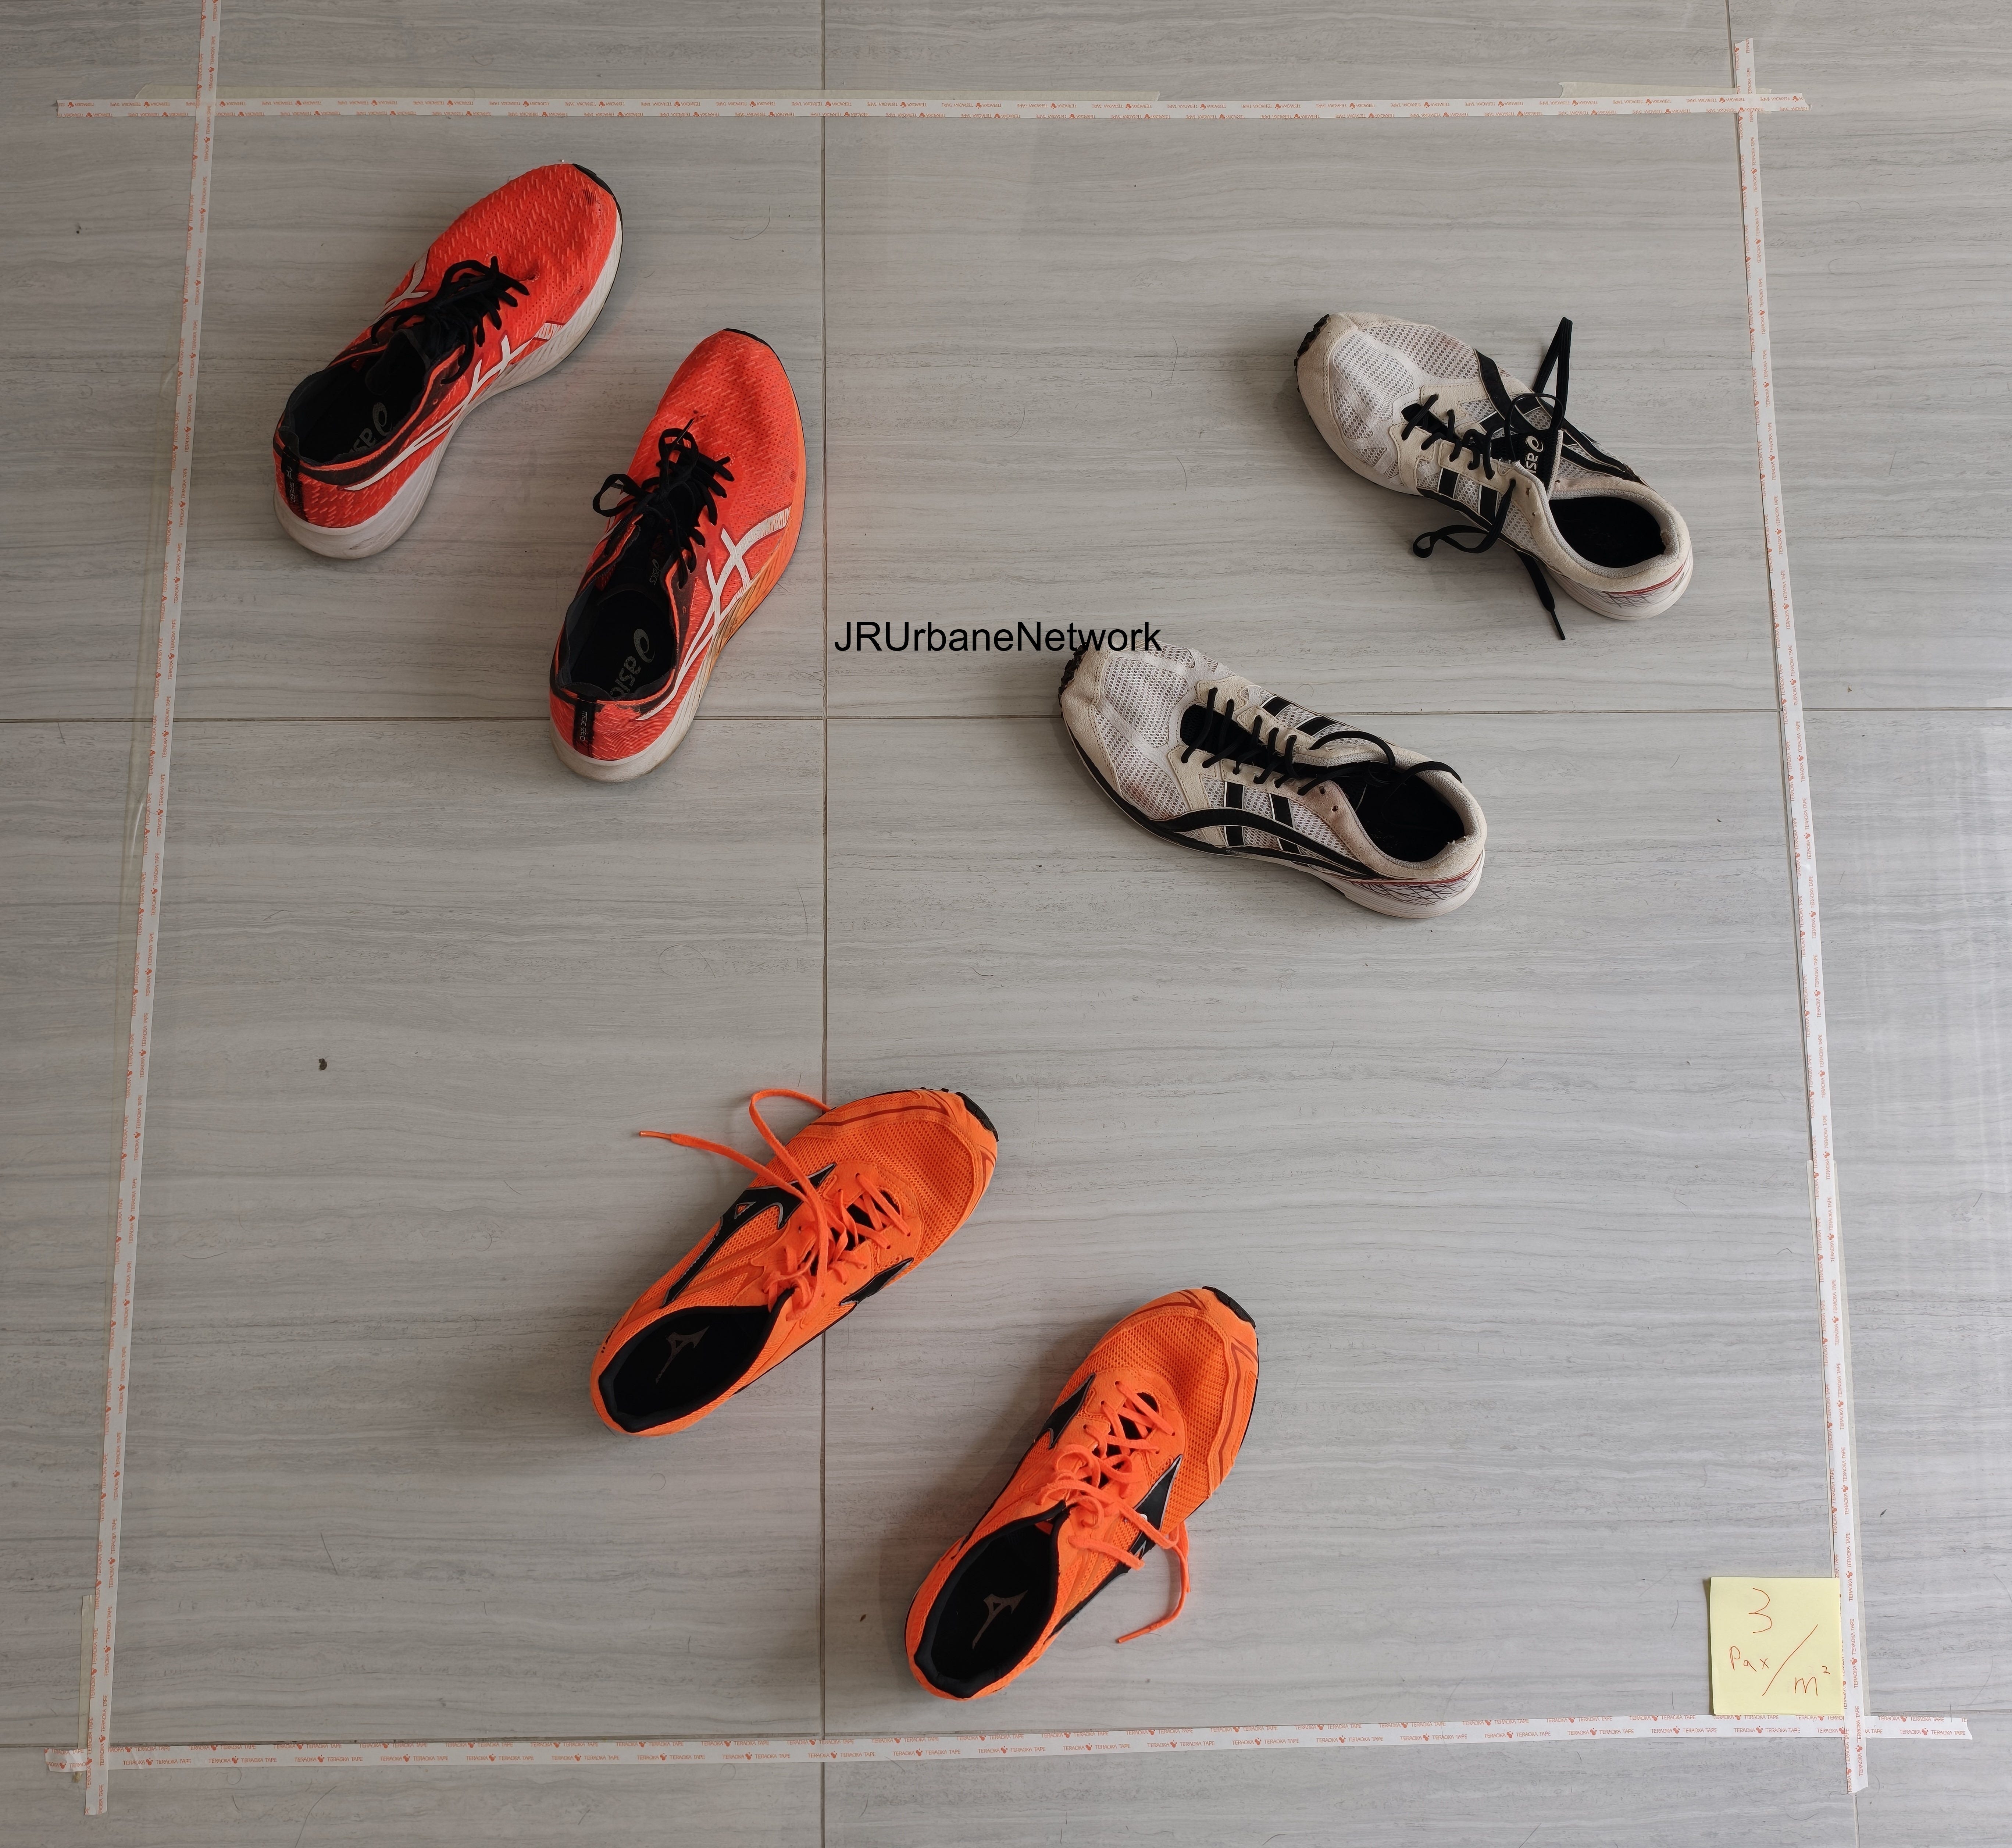
Before you judge, look at the image above again. Remember that a human's torso, chest, and arms are much wider than their literal footprint. In addition people here could be wearing coats, carrying bags, not taking their backpacks off, watching shorts on their phone etc. all of this needs to fit inside the marked out box. Just imagine you are the person wearing the orange and black shoes at the bottom of the image. The door is at the top, and you are trying to exit the train. This can help you conceptualize what it feels like moving around in a train deemed by the Japanese and South Koreans to be just under 100% capacity feels like. This density would be considered ~75% capacity in North American Subways and ~50% capacity in China. Regardless, at this level, you can still move quite freely.
4 passengers/m²: The Emerging International Standard
I add one more “passenger” and below is now 4 passengers/m² of standee density. This is the average density the busiest section of TTC Subway Yonge Line was operating at during the AM Peak in 2018 and the crowding you should expect when taking any Hong Kong MTR line during rush hour today. It is also the level of crowding that starts making the news in North America as a problem to fix.
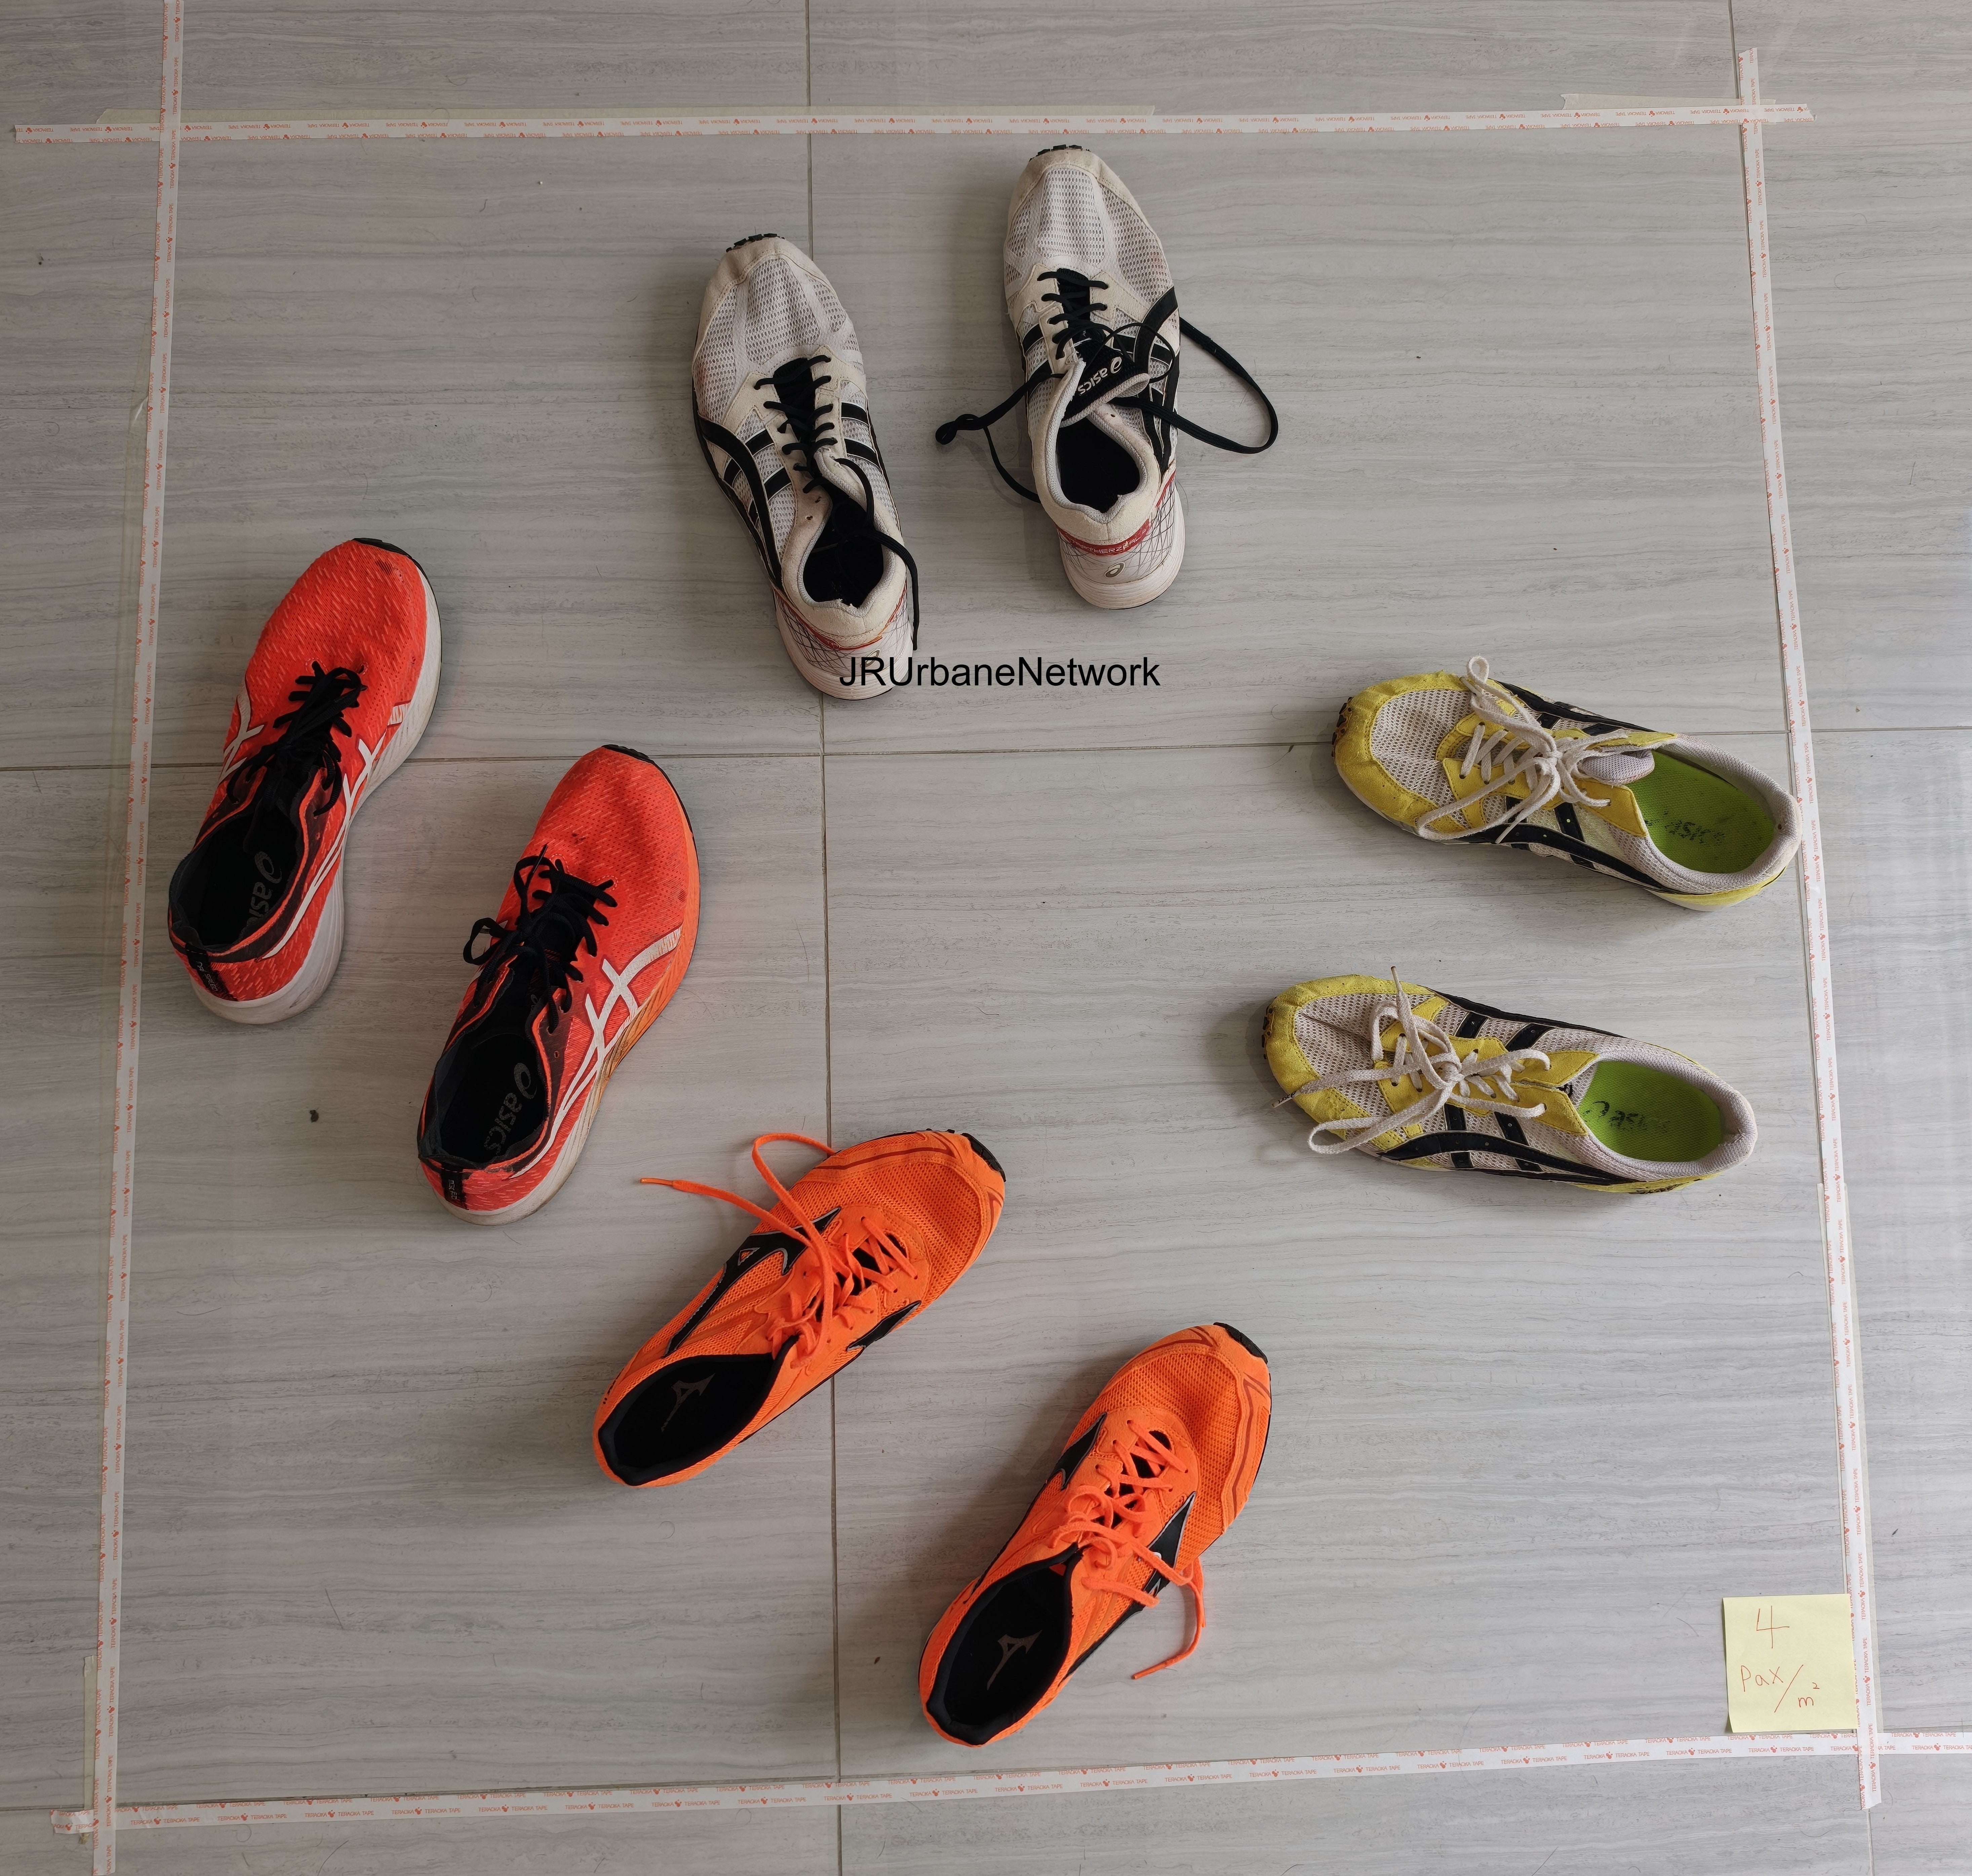
Again, visualize that the hypothetical people filling those shoes are carrying bags and not removing their backpacks. You, at the bottom, need to exit through the train doors at the top of the image. Imagine moving around the train with this level of crowding. In this situation I think you would most likely require a lot of side stepping and “‘scuse me’s”. This is the converging international standard for standee density for an urban/suburban train being at 100% capacity, used in North America and Europe. In Japan and South Korea this would be about 120-135% capacity and China would deem it to be under 70% capacity.
6 passengers/m²: The Chinese Standard
I add two more “passengers”. This is the standee density for the old definition of 100% capacity used around the world and still officially used in China today, 6 passengers/m² of standee density. Hong Kong and some train manufacturers may call it “crush loaded” density as a higher tier of capacity on top of the maximum capacity threshold where the more modern 4 passengers/m² of standee density is used.
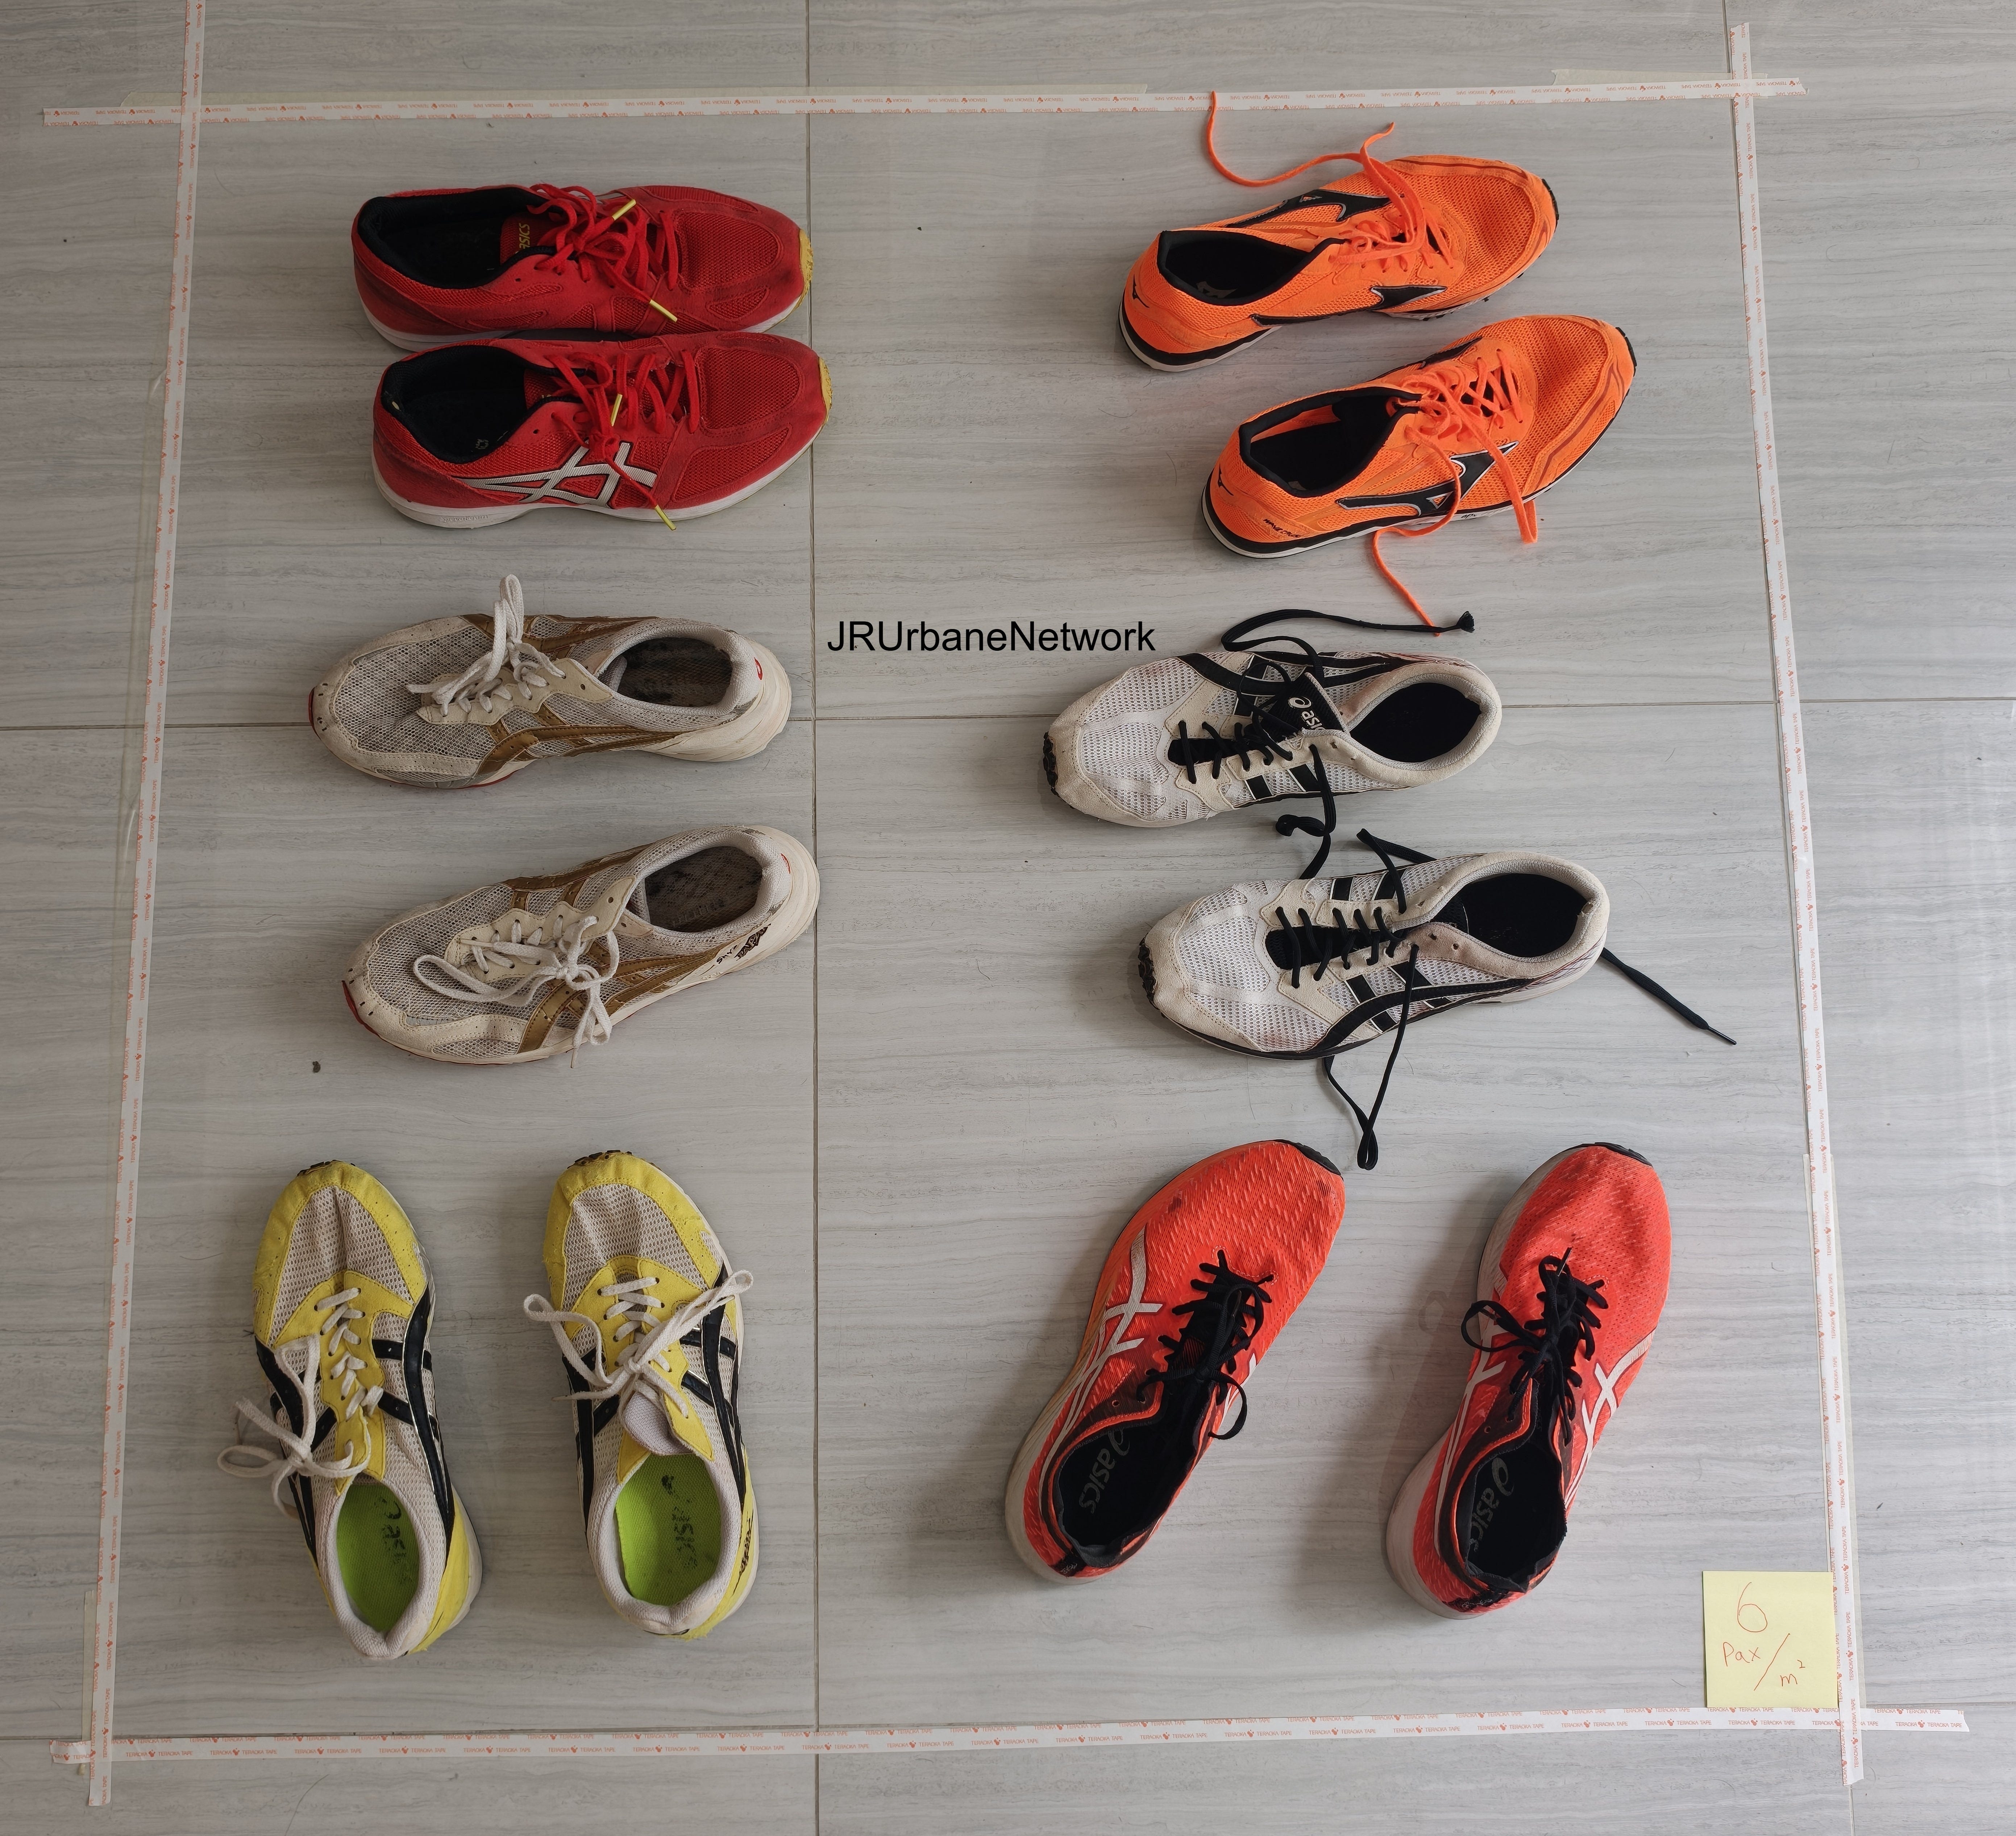
You will have physical contact with all adjacent passengers at all times. If you need to exit the train in the above environment, you will be squeezing between passengers and maybe doing a little pushing. This would be 125% capacity in North America or a bit more crowded than the busiest sections of the Lexington Line in the New York City Subway during the AM peak before the opening of the 2nd Ave Subway Phase 1. By Japanese and Korean crowding standards this is close to 200% capacity.
This is the level of crowding that prompted Seoul Metro to consider putting some cattle cars on Seoul Metro Line 4. This is also the average level of crowding you see on the most crowded sections of train lines in Japan before the ridership collapse following the COVID-19 pandemic. Before that period 2017-2018 eleven segments on the Tokyo area during the AM peak regularly approached 200% capacity according to the MLIT. Including greatest hits like the Tokyo Metro Tozai Line, Tokyu Den-en Toshi Line, JR-E Chuo Rapid, Tokaido, Chuo-Sobu Local and Keihin-Tohoku Line.

Following the analysis I presented in the beginning of the post, 180%-200% crowding reported by the MLIT equals about 6-6.25 passengers/m² of standee density.
9 passengers/m²: Crush Load
I add three more “passengers”, making it 9 passengers/m². This is the old definition of “crush loaded” and basically is not thought about anymore in the Western World. You need really motivated commuters and/or pushers a la Japan to consistently pack trains to this average.
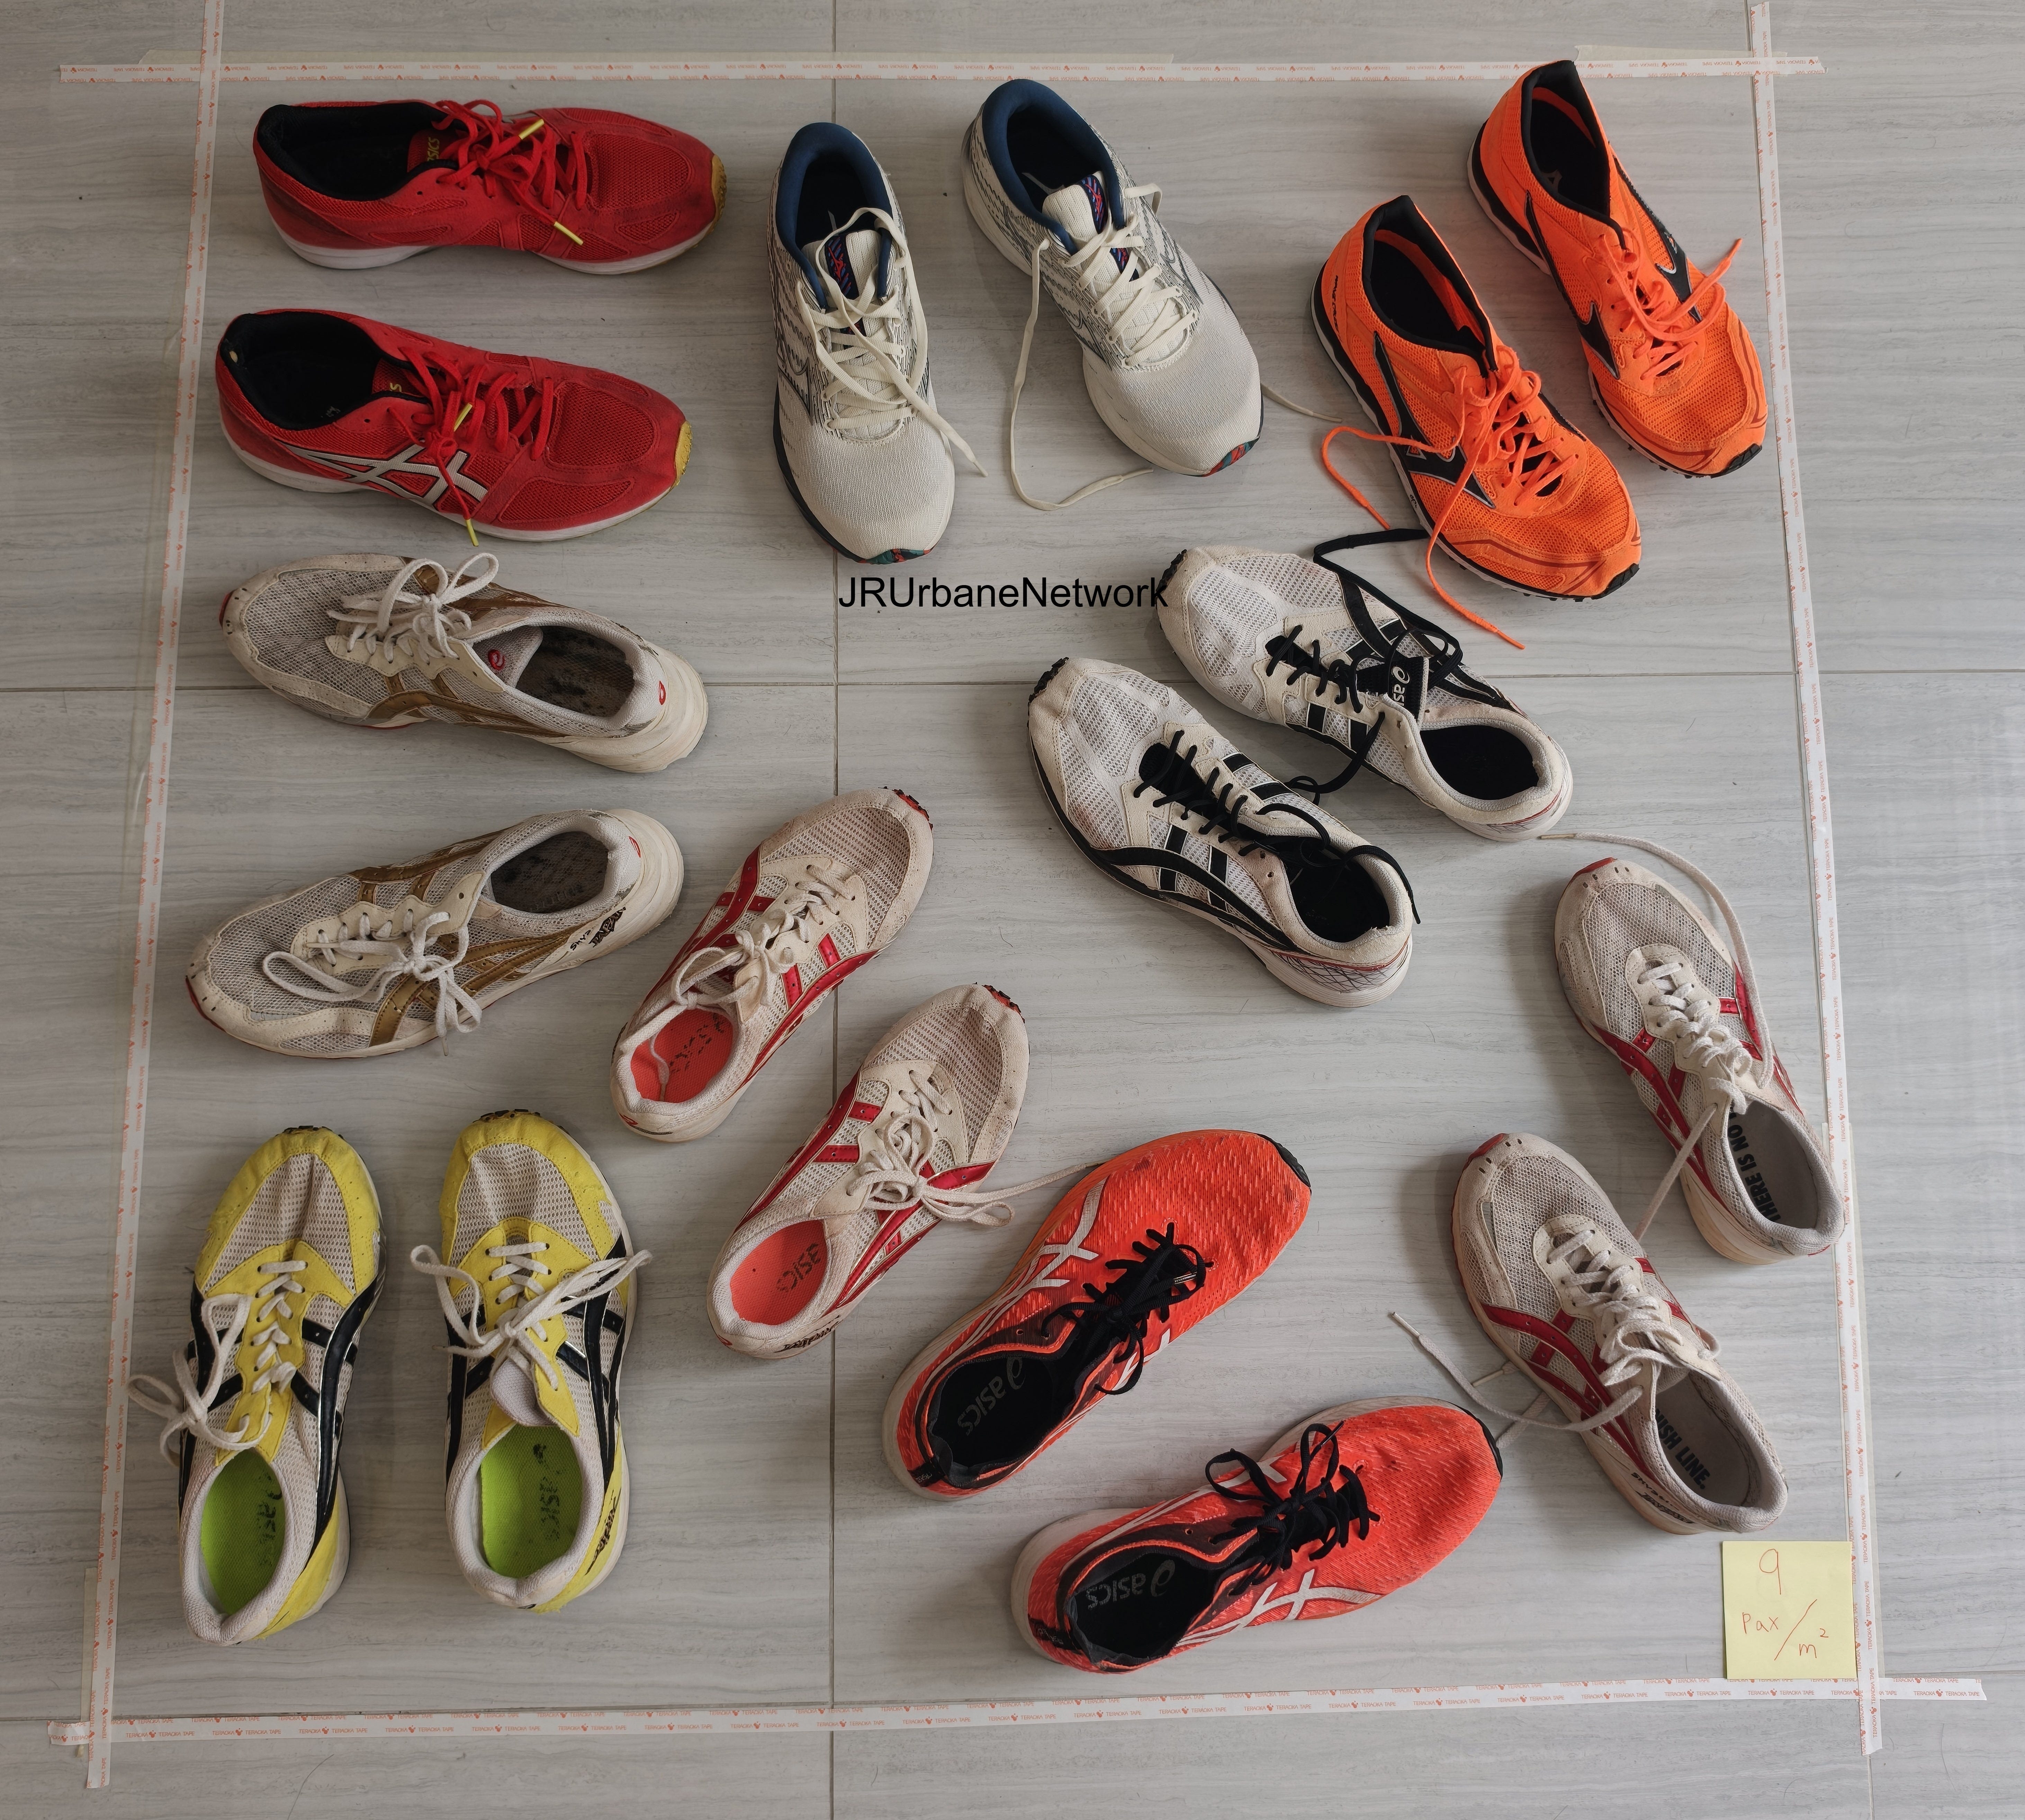
I personally experienced this on Guangzhou Metro Line 3 before relief lines opened in the 2020s, and on Seoul Metro Line 9 before service adjustments increased capacity. It was a deeply dehumanizing experience; you can not move. Your arms are pinned to your sides. Every time your chest expands to inhale, your chest pushes out and presses against the six other people around you. When the six people surrounding your body inhale, their chests push against you at different times because total strangers packed in a metro car are obviously not synchronizing their breathing with each other. When you want to leave the train and you are not right at the door there will be a lot of pushing. Sometimes there will be shouting. You will be stepping on people’s feet but people will step on your feet with greater frequency. Would not recommend.
Interpreting Congestion Rates in Practice
Going back to the start of article where Japan’s MLIT has published national train crowding data for 2025. When you read that Tokyo’s average train congestion rate is 143%. Just remember, despite all the technical jargon surrounding this metric, that figure is not an objective physical measurement but a bureaucratic baseline. The real story lies in what the local transit agency decides to call a ‘full’ train. The next time you see a congestion rate, remember that the number tells you as much about the country's standards as it does about your commute. The real question is not “how crowded is the train?” but “what does your country consider acceptable?”.
Now that you have that perspective, let’s compare the MLIT report’s crowding numbers with other places around the world in the next post coming soon so…
Thanks for reading this global analysis of train crowding. Please like, share, and subscribe for more news and analysis of global railway operations.
Or drop me a Ko-fi if you like what you read!

The secret third thing is the roof or hanging outside of the train practiced in some countries but those sources of capacity are not official.
The line in question in the video (line 13) was operating at 145% capacity.
I love your pix of ramen & shoes to illustrate crowding standards.
I recall visiting Hong Kong during Christmas one year where they cordoned off roads and MTR stations. Got pretty scary but MTR coped pretty well in getting people moving along.